Quarterly Portfolio Fund update
Stock and bond markets*
| INDEX | CLOSE | Q1 |
|---|---|---|
| S&P/TSX Composite | 32,768.04 | 3.33% |
| Dow Jones Industrial Average | 46,341.51 | -3.58% |
| S&P 500 Index | 6,528.52 | -4.63% |
| NASDAQ Composite | 21,590.63 | -7.11% |
| 10-year Canadian Bond Yield | 3.46% | 0.04% |
| 10-year U.S. Treasury Yield | 4.30% | 0.12% |
| Canadian Dollar | US$0.72 | -1.67% |
| Bank of Canada Prime Rate 4.45% |
*Performance ending March 31, 2026. Sources: Morningstar Direct, Bank of Canada and U.S. Department of the Treasury.
Read our weekly market recap for the latest information on the financial markets, insights around current headlines, special reports, and more.
How Portfolio Funds performed during Q1 2026
Portfolios funds performed modestly in the first quarter, with growth portfolios outpacing income portfolios.
Note: Rates of return for each portfolio are provided below on an after-fees (net) basis. Given that fees are only applied at the portfolio level, all references to underlying fund performance are before fees (gross).
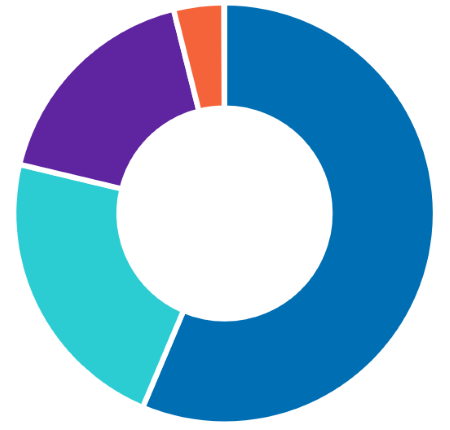
Co-operators Income Portfolio: low risk
Designed to achieve interest income, and the preservation and moderate growth of capital, with low levels of volatility.
The Co-operators Canadian Fixed Income Fund was the sole fund within the portfolio to outperform its benchmark during the quarter, exceeding it by 0.11% and contributing 3 basis points (bps) to active returns.
Within the portfolio’s equity allocation, the Co-operators Mawer Canadian Equity Fund underperformed on a relative basis, lagging its benchmark by 1.23%, primarily due to limited exposure to the energy sector, which performed strongly. Commodity related exposures across the portfolio helped support overall results, contributing to a 2.71% portfolio return for the quarter and adding 14 bps to the absolute return.
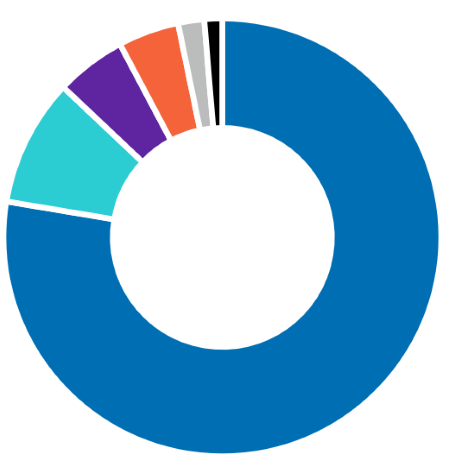
- Canadian Fixed Income 77.91%
- Canadian Equity 9.87%
- U.S. Equity 4.99%
- International Equity 4.71%
- Foreign Fixed Income 1.34%
- Cash & Other Net Assets 1.18%
| Guarantee level | Q1 | 1 year | 3 year | 5 year | 10 year | Since inception Dec. 22, 2014 |
|---|---|---|---|---|---|---|
| 75-75 | -0.21% | 2.03% | 4.11% | 1.02% | 1.75% | 1.83% |
| 75-100 | -0.24% | 1.92% | 4.00% | 0.91% | 1.64% | 1.72% |
| 100-100 | -0.33% | 1.54% | 3.61% | 0.53% | 1.25% | 1.33% |
| Top 10 holdings | |
|---|---|
| Co-operators Canadian Fixed Income Fund | 29.96% |
| Co-operators BlackRock Canada Universe Bond Index Fund | 29.94% |
| Co-operators Fidelity Canadian Bond Fund | 19.96% |
| Co-operators Canadian Equity Fund | 5.12% |
| Co-operators Mawer Canadian Equity Fund | 5.05% |
| Co-operators Mawer International Equity Fund |
4.93% |
| Co-operators BlackRock U.S. Equity Index Fund | 2.52% |
| Co-operators U.S. Equity Fund | 2.52% |
| The top 10 investments make up 100.00% of the fund. Total number of investments: 8 |
|
Co-operators Balanced Income Portfolio: low to moderate risk
Designed to achieve both interest income and capital growth, with relatively low levels of volatility.
The Co-operators Canadian Fixed Income Fund was the sole fund within the portfolio to outperform its benchmark during the quarter, exceeding it by 0.11% and contributing 3 basis points (bps) to active returns.
Within the portfolio’s equity allocation, the Co-operators U.S. Equity Fund underperformed on a relative basis, detracting 19 bps from active returns. Relative performance was impacted by underexposure to the energy sector, as well as security selection within the information technology sector, where segments of the software industry faced valuation pressure during the quarter.
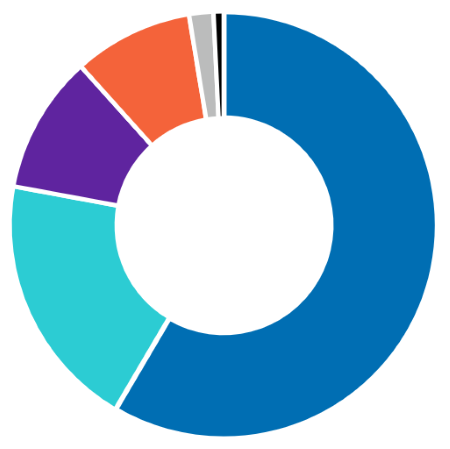
- Canadian Fixed Income 58.89%
- Canadian Equity 19.71%
- U.S. Equity 9.95%
- International Equity 9.39%
- Cash & Other Net Assets 1.55%
- Foreign Fixed Income 0.81%
| Guarantee level | Q1 | 1 year | 3 year | 5 year | 10 year | Since inception Dec. 22, 2014 |
|---|---|---|---|---|---|---|
| 75-75 | -0.21% | 4.58% | 6.35% | 2.98% | 3.40% | 3.37% |
| 75-100 | -0.25% | 4.68% | 6.18% | 2.81% | 3.23% | 3.21% |
| 100-100 | -0.39% | 4.06% | 5.55% | 2.20% | 2.62% | 2.60% |
| Top 10 holdings | |
|---|---|
| Co-operators Canadian Fixed Income Fund | 24.92% |
| Co-operators BlackRock Canada Universe Bond Index Fund | 24.91% |
| Co-operators Canadian Equity Fund | 10.22% |
| Co-operators Mawer Canadian Equity Fund |
10.09% |
| Co-operators Fidelity Canadian Bond Fund | 9.96% |
| Co-operators Mawer International Equity Fund |
9.84% |
| Co-operators BlackRock U.S. Equity Index Fund | 5.03% |
| Co-operators U.S. Equity Fund | 5.03% |
| The top 10 investments make up 100.00% of the fund. Total number of investments: 8 |
|
Co-operators Balanced Growth Portfolio: low to moderate risk
Designed to achieve both interest income and capital growth, with relatively modest levels of volatility.
The Co-operators Fidelity True North® Fund delivered a positive absolute return of 2.22% during the quarter but underperformed its benchmark on a relative basis, lagging by 1.72% and detracting 17 basis points (bps) from active returns. Relative performance was influenced by the fund’s positioning, including overweight exposure to consumer staples and industrials, along with underweight exposure to financials and materials.
Within the portfolio’s international equity allocation, the Co-operators U.S. Equity Fund also underperformed, detracting 19 bps from active returns
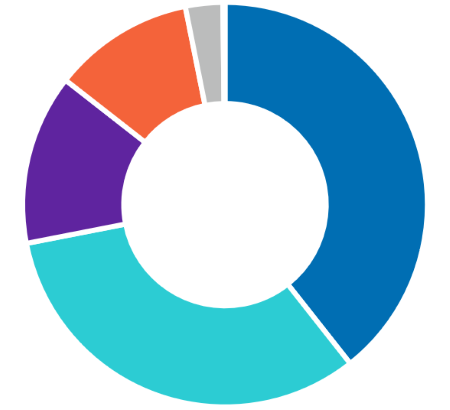
- Canadian Fixed Income 39.32%
- Canadian Equity 33.78%
- International Equity 14.25%
- U.S. Equity 10.39%
- Cash & Other Net Assets 1.98%
- Foreign Fixed Income 0.28%
| Guarantee level | Q1 | 1 year | 3 year | 5 year | 10 year | Since inception Dec. 22, 2014 |
|---|---|---|---|---|---|---|
| 75-75 | 0.13% | 8.77% | 8.86% | 5.18% | 5.11% | 4.92% |
| 75-100 | 0.09% | 8.59% | 8.68% | 5.01% | 4.93% | 4.75% |
| 100-100 | -0.06% | 7.95% | 8.04% | 4.39% | 4.31% | 4.14% |
| Top 10 holdings | |
|---|---|
| Co-operators Canadian Fixed Income Fund | 19.89% |
| Co-operators BlackRock Canada Universe Bond Index Fund | 19.88% |
| Co-operators Canadian Equity Fund | 15.30% |
| Co-operators Mawer International Equity Fund |
14.73% |
| Co-operators Fidelity True North® Fund | 10.10% |
| Co-operators Mawer Canadian Equity Fund | 10.07% |
| Co-operators BlackRock U.S. Equity Index Fund | 5.02% |
| Co-operators U.S. Equity Fund | 5.01% |
| The top 10 investments make up 100.00% of the fund. Total number of investments: 8 |
|
Co-operators Growth Portfolio: low to moderate risk
Designed to achieve long-term capital growth, with some interest income.
The Co-operators Canadian Equity Fund delivered a steady absolute return during the quarter but underperformed its benchmark by 0.52%, detracting 10 basis points (bps) from active returns. Relative performance was impacted by modest underweight exposure to the energy sector.
The Co-operators Fidelity Global Fund also underperformed on a relative basis, posting a −5.96% return for the quarter and lagging its benchmark by just over 4.5%, which detracted 45 bps from active returns.
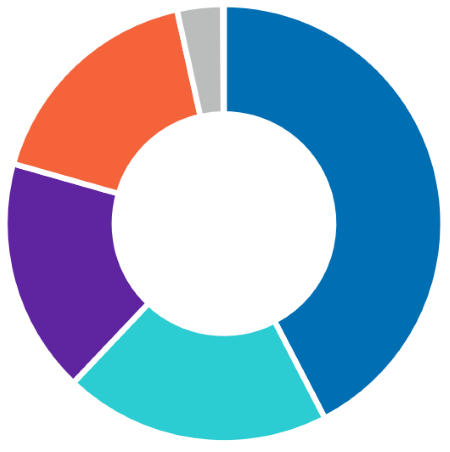
- Canadian Equity 43.56%
- International Equity 20.68%
- Canadian Fixed Income 19.60%
- U.S. Equity 13.75%
- Cash & Other Net Assets 2.27%
- Foreign Fixed Income 0.14%
| Guarantee level | Q1 | 1 year | 3 year | 5 year | 10 year | Since inception Dec. 22, 2014 |
|---|---|---|---|---|---|---|
| 75-75 | -0,29% | 12.27% | 11.28% | 7.11% | 6.86% | 6.53% |
| 75-100 | -0.33% | 12.09% | 11.10% | 6.93% | 6.68% | 6.36% |
| 100-100 | -0.47% | 11.42% | 10.45% | 6.30% | 6.05% | 5.73% |
| Top 10 holdings | |
|---|---|
| Co-operators Canadian Equity Fund | 20.33% |
| Co-operators Mawer Canadian Equity Fund |
15.05% |
| Co-operators Mawer International Equity Fund | 14.68% |
| Co-operators Fidelity True North® Fund | 10.07% |
| Co-operators Fidelity Global Fund | 10.05% |
| Co-operators Canadian Fixed Income Fund |
9.91% |
| Co-operators BlackRock Canada Universe Bond Index Fund |
9.91% |
| Co-operators BlackRock U.S. Equity Index Fund | 5.00% |
| Co-operators U.S. Equity Fund | 5.00% |
| The top 10 investments make up 100.00% of the fund. Total number of investments: 9 |
|
Co-operators Maximum Growth Portfolio: moderate risk
Designed to achieve maximum capital growth over the long term.
The Co-operators Fidelity Global Fund underperformed on a relative basis, posting a −5.96% return, which detracted 45 basis points (bps) from active returns. Relative performance was impacted by overweight exposure to the consumer discretionary sector, along with limited exposure to the energy sector.
Within the Canadian equity allocation, the Co-operators Mawer Canadian Equity Fund underperformed by 1.23% for the quarter. Commodity related exposures across the portfolio supported results, contributing to a 2.71% return for the quarter and adding 41 bps to the absolute return contribution.
- Canadian Equity 58.02%
- International Equity 20.70%
- U.S. Equity 18.86%
- Cash & Other Net Assets 2.40%
- Canadian Fixed Income 0.02%
| Guarantee level | Q1 | 1 year | 3 year | 5 year | 10 year | Since inception Dec. 22, 2014 |
|---|---|---|---|---|---|---|
| 75-75 | -0.12% | 17.13% | 14.25% | 9.64% | 8.87% | 8.24% |
| 75-100 | -0.17% | 16.88% | 14.00% | 9.40% | 8.64% | 8.01% |
| 100-100 | -0.36% | 16.00% | 13.15% | 8.58% | 7.82% | 7.20% |
| Top 10 holdings | |
|---|---|
| Co-operators Canadian Equity Fund | 20.26% |
| Co-operators Fidelity True North® Fundd | 15.05% |
| Co-operators Mawer Canadian Equity Fund |
15.00% |
| Co-operators Mawer International Equity Fun |
14.63% |
| Co-operators BlackRock Canadian Equity Index Fund | 10.10% |
| Co-operators Fidelity Global Fund |
10.01% |
| Co-operators BlackRock U.S. Equity Index Fund | 7.48% |
| Co-operators U.S. Equity Fund | 7.47% |
| The top 10 investments make up 100.00% of the fund. Total number of investments: 8 |
|
Key take-aways
Markets entered the year supported by solid economic momentum, resilient earnings and expectations that central banks would begin easing monetary policy later in 2026. That backdrop changed in late February following the escalation of U.S.–Israeli military action against Iran and the disruption of traffic through the Strait of Hormuz, a critical pathway for global energy products.
The resulting surge in oil prices triggered a sharp repricing of inflation risk, reversing rate‑cut expectations and broadening volatility across asset classes. Commodities performed well globally, while equities and bonds faced headwinds as markets attempted to price a more uncertain growth‑inflation mix. Central banks, including the Bank of Canada and the U.S. Federal Reserve, held policy rates steady throughout the quarter, underscoring the heightened volatility introduced by geopolitical risks coupled with domestic economic uncertainty.
Bottom line: The market’s day-to-day ups and downs can be stressful. But it’s important to put market performance into perspective, while keeping your goals front and centre. Staying invested – and continuing to invest – throughout market fluctuations is the best way to capitalize on likely market recoveries. If you have questions about your investments, a Co-operators financial representative is always ready to help.
Interested in more tips and insights? Check out our Market View page for investment basics and weekly updates on market performance. You can even sign up to have this news sent directly to your inbox.
Sales charges, expenses and other fees
Fees and expenses reduce the return on your investment. For details, please refer to your Policy and Information Folder.
Current rates of return are available on our Segregated Fund Performance page. Your personal rate of return will vary, depending on the contributions and withdrawals you make over time. For details, please refer to your Policy Statement.
If you have questions about your investments, contact your Co-operators financial representative.
Versatile Portfolios NavigatorTM is a flexible and secure investment option
Whether you’re saving for the unexpected, for retirement or for that big item on your bucket list, your path to financial success is unique. Versatile Portfolios NavigatorTM can provide you with the flexibility you need. In addition to select and diverse investment options from top, trusted investment managers, they offer a suite of portfolio funds – all actively managed and consisting of underlying funds – that help you take the guesswork out of investing.
© Co-operators Life Insurance Company.
1900 Albert St., Regina, SK S4P 4K8
Segregated funds and annuities are administered by Co-operators Life Insurance Company. Not all products are available in all provinces. This material is provided for informational purposes only. Please refer to your policy for applicable coverage details, limitations, and exclusions. The information contained in this communication was obtained from sources believed to be reliable; however, we cannot guarantee that it is accurate or complete. This communication is provided as a general source of information and should not be considered personal investment advice or solicitation to buy or sell any investment. Co-operators® is a registered trademark of The Co-operators Group Limited and is used with permission. Versatile Portfolios Navigator™ is an investment product which may include features or options such as segregated funds, portfolios of segregated funds or guaranteed rates. Guaranteed benefits are payable on death or maturity (reduced proportionately by withdrawals from, or investment transfers out of, the segregated funds). No guarantee is provided on surrender or cancellation. Subject to any applicable death and maturity guarantee, any part of the premium or other amount that is allocated to a segregated fund is invested at the risk of the policyholder and may increase or decrease in value. Ask your advisor for details. Versatile Portfolios Navigator™ is a trademark of Co-operators Life Insurance Company. True North® is a registered trademark of Fidelity Investments Canada ULC and used with permission.
Returns, investment segmentation and top holdings as of March 31, 2026. Rates of return for periods less than one year are simple rates of return. All others are annualized rates of return. Securities regulations do not allow us to report performance for a fund that has been available for less than one year. The returns reflect changes in unit value and assume that all income/realized net gains are retained by the segregated fund in the periods indicated and are reflected in higher unit values of the fund. The returns do not take into account sales, redemption, distribution or other optional charges or income taxes payable that would have reduced returns or performance. Past performance of any fund is not necessarily indicative of its future performance.
If you have questions or want to discuss your investments, please contact your authorized financial representative. In Quebec, a licensed insurance advisor is a Financial Security Advisor or a Representative.