Quarterly Aviator Portfolios® update
Stock and bond markets*
| INDEX | CLOSE | Q1 |
|---|---|---|
| S&P/TSX Composite | 32,768.04 | 3.33% |
| Dow Jones Industrial Average | 46,341.51 | -3.58% |
| S&P 500 Index | 6,528.52 | -4.63% |
| NASDAQ Composite | 21,590.63 | -7.11% |
| 10-year Canadian Bond Yield | 3.46% | 0.04% |
| 10-year U.S. Treasury Yield | 4.30% | 0.12% |
| Canadian Dollar | US$0.72 | -1.67% |
| Bank of Canada Prime Rate 4.45% |
*Performance ending March 31, 2026. Sources: Morningstar Direct, Bank of Canada and U.S. Department of the Treasury.
Read our weekly market recap for the latest information on the financial markets, insights around current headlines, special reports, and more.
How Aviator Portfolios® performed during Q1 2026
Aviator Portfolios® turned in mixed performances in the first quarter. The diversified portfolio outpaced the growth and income portfolios, with underperformance concentrated in the equity segment.
Note: Rates of return for each portfolio are provided below on an after-fees (net) basis. Given that fees are only applied at the portfolio level, all references to underlying fund performance are before fees (gross).
Co-operators Aviator Income Plus Portfolio: low risk
Designed to achieve interest income, and the preservation and moderate growth of capital, with low levels of volatility.
The Co-operators Templeton Global Bond Fund outperformed its benchmark Q1 2026 against a difficult macroeconomic backdrop, as conflict in the Middle East caused oil supply shocks and raised inflation concerns. Increased inflation expectations will typically affect bond markets through increased yields. The fund benefitted from its duration positioning in several regions and currency exposures, particularly in Brazil and Kazakhstan. The global bond fund achieved 4 basis points of active return contribution despite its 5% weight in the portfolio.
The Co-operators Commercial Mortgage Fund beat its benchmark by 0.7%, adding 10 basis points to the portfolio’s active return. Bond yields were volatile toward the end of the quarter and mortgage spreads contracted slightly. The structure of the fund is set up in a way that volatile interest rate environments do not cause the same return impact as standard fixed income products.
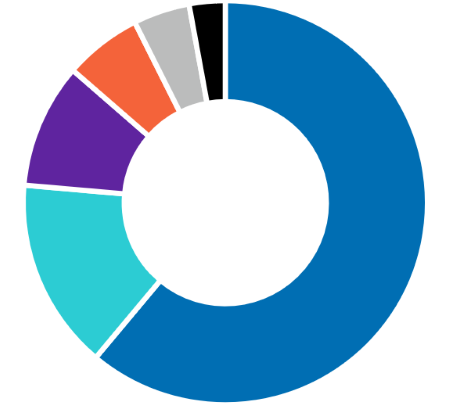
- Canadian Fixed Income 61.55%
- Canadian Equity 16.85%
- Foreign Fixed Income 10.46%
- U.S. Equity 5.10%
- Cash & Other Net Assets 3.92%
- International Equity 2.12%
Series 100
| Guarantee Level | Q1 | 1 year | 3 year | 5 year | Since inception Dec. 2, 2019 |
|---|---|---|---|---|---|
| 75-75 | -0.43% | 3.66% | 5.57% | 2.48% | 2.80% |
| 75-100 | -0.47% | 3.50% | 5.40% | 2.31% | 2.62% |
Series 500
| Guarantee Level | Q1 | 1 year | 3 year | 5 year | Since inception Oct. 2, 2017 |
|---|---|---|---|---|---|
| 75-75 | -0.38% | 3.89% | 5.81% | 2.70% | 2.88% |
| 75-100 | -0.42% | 3.72% | 5.63% | 2.54% | 2.71% |
| Top 10 holdings | |
|---|---|
| Co-operators Corporate Bond Fund | 24.96% |
| Co-operators Canadian Fixed Income Fund | 20.00% |
| Co-operators Commercial Mortgage Fund | 14.94% |
| Co-operators Preferred Share Equity Fund | 10.00% |
| Co-operators Global Equity Fund | 7.51% |
| Co-operators ClearBridge Canadian Equity Fund | 5.07% |
| Co-operators Templeton Global Bond Fund | 4.99% |
| Co-operators Franklin Canadian Short Term Bond Fund | 4.99% |
| Co-operators Brandywine U.S. High Yield Fund | 4.98% |
| Co-operators Concentrated Canadian Equity Fund | 2.56% |
| The top 10 investments make up 100.00% of the fund. Total number of investments: 10 |
|
Co-operators Aviator Diversified Portfolio: low to moderate risk
Designed to achieve both interest income and capital growth, with modest levels of volatility.
The Co-operators Fidelity Global Real Estate Fund outpaced its benchmark by almost 2%, contributing 10 basis points to the portfolio’s active return. The fund benefitted from investments in U.S. domiciled properties, underweight exposure to office Real Estate Investment Trusts (REITs) and overweight exposure to industrial REITs. Real estate markets are shaped by interest rate expectations which have been an area of uncertainty over the past few months due to tensions in the Middle East igniting inflation and growth concerns.
The Co-operators Commercial Mortgage Fund beat its benchmark by 0.7%, adding 8 basis points to the portfolio’s active return. Bond yields were volatile toward the end of the quarter and mortgage spreads contracted slightly. The structure of the fund is set up in a way that volatile interest rate environments do not cause the same return impact as standard fixed income products.
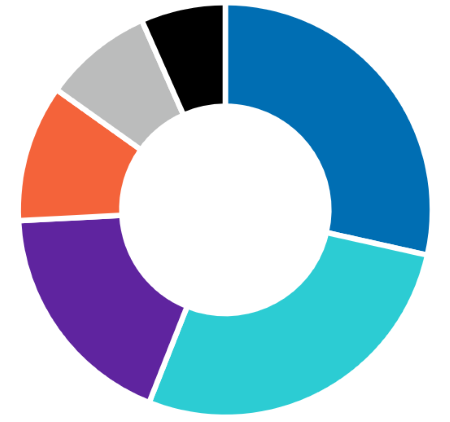
- Canadian Fixed Income 29.05%
- Canadian Equity 28.68%
- U.S. Equity 18.89%
- Foreign Fixed Income 10.76%
- International Equity 7.70%
- Cash & Other Net Assets 4.92%
Series 100
| Guarantee Level | Q1 | 1 year | 3 year | 5 year | Since inception Dec. 2, 2019 |
|---|---|---|---|---|---|
| 75-75 | 0.02% | 8.52% | 8.47% | 4.71% | 5.24% |
| 75-100 | -0.02% | 8.35% | 8.29% | 4.54% | 5.05% |
Series 500
| Guarantee Level | Q1 | 1 year | 3 year | 5 year | Since inception Oct. 2, 2017 |
|---|---|---|---|---|---|
| 75-75 | 0.07% | 8.76% | 8.70% | 4.94% | 4.75% |
| 75-100 | 0.03% | 8.58% | 8.53% | 4.76% | 4.57% |
| Top 10 holdings | |
|---|---|
| Co-operators Canadian Fixed Income Fund | 17.42% |
| Co-operators Concentrated Canadian Equity Fund | 12.77% |
| Co-operators Global Equity Fund | 12.47% |
| Co-operators Commercial Mortgage Fund | 12.40% |
| Co-operators Preferred Share Equity Fund | 9.96% |
| Co-operators ClearBridge Canadian Equity Fund | 7.57% |
| Co-operators Small-Cap U.S. Equity Index Fund | 7.49% |
| Co-operators Brandywine U.S. High Yield Fund | 7.43% |
| Co-operators Fidelity Global Real Estate Fund | 5.01% |
| Co-operators Templeton Global Bond Fund | 4.97% |
| The top 10 investments make up 97.49% of the fund. Total number of investments: 11 |
|
Co-operators Aviator Growth Portfolio: moderate risk
Designed to achieve long-term capital growth, with some interest income.
The Co-operators Global Equity Fund had a challenging first quarter due to the fund’s underweight exposure to the energy sector which saw strong returns over all other areas of the market on the back of volatile and rising oil prices. Security selection within industrials, information technology and health care also contributed to the fund’s relative underperformance.
The Co-operators Templeton Emerging Markets Fund added 18 basis points to the portfolio's active return in Q1. The fund's top holdings relative to the benchmark included SK Hynix, Hyundai Motor and Taiwan Semiconductor Manufacturing Company (TSMC). TSMC, the largest holding in the fund, continued to grow as AI enthusiasm remained a driving force behind global stock market returns during the quarter.
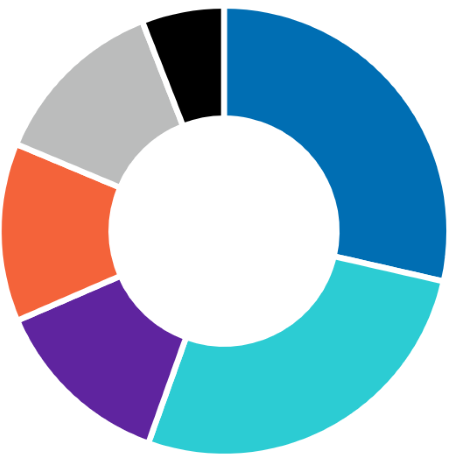
- Canadian Equity 29.42%
- U.S. Equity 27.76%
- Canadian Fixed Income 13.17%
- Foreign Fixed Income 12.82%
- International Equity 11.83%
- Cash & Other Net Assets 5.00%
Series 100
| Guarantee Level | Q1 | 1 year | 3 year | 5 year | Since inception Dec. 2, 2019 |
|---|---|---|---|---|---|
| 75-75 | -0.14% | 9.70% | 9.41% | 5.43% | 5.95% |
| 75-100 | -0.18% | 9.52% | 9.23% | 5.26% | 5.75% |
Series 500
| Guarantee Level | Q1 | 1 year | 3 year | 5 year | Since inception Oct. 2, 2017 |
|---|---|---|---|---|---|
| 75-75 | -0.08% | 9.94% | 9.65% | 5.66% | 5.22% |
| 75-100 | -0.13% | 9.76% | 9.47% | 5.49% | 5.05% |
| Top 10 holdings | |
|---|---|
| Co-operators Global Equity Fund | 17.44% |
| Co-operators Concentrated Canadian Equity Fund | 13.26% |
| Co-operators ClearBridge Canadian Equity Fund | 10.08% |
| Co-operators Fidelity Global Real Estate Fund | 10.01% |
| Co-operators Small-Cap U.S. Equity Index Fund | 9.98% |
| Co-operators Brandywine U.S. High Yield Fund | 9.90% |
| Co-operators Commercial Mortgage Fund | 8.42% |
| Co-operators Preferred Share Equity Fund | 7.46% |
| Co-operators Corporate Bond Fund | 4.97% |
| Co-operators Templeton Global Bond Fund | 4.96% |
| The top 10 investments make up 96.48% of the fund. Total number of investments: 11 |
|
Key take-aways
Markets entered the year supported by solid economic momentum, resilient earnings and expectations that central banks would begin easing monetary policy later in 2026. That backdrop changed in late February following the escalation of U.S.–Israeli military action against Iran and the disruption of traffic through the Strait of Hormuz, a critical pathway for global energy products.
The resulting surge in oil prices triggered a sharp repricing of inflation risk, reversing rate‑cut expectations and broadening volatility across asset classes. Commodities performed well globally, while equities and bonds faced headwinds as markets attempted to price a more uncertain growth‑inflation mix. Central banks, including the Bank of Canada and the U.S. Federal Reserve, held policy rates steady throughout the quarter, underscoring the heightened volatility introduced by geopolitical risks coupled with domestic economic uncertainty.
Bottom line: The market’s day-to-day ups and downs can be stressful. But it’s important to put market performance into perspective, while keeping your goals front and centre. Staying invested – and continuing to invest – throughout market fluctuations is the best way to capitalize on likely market recoveries. If you have questions about your investments, a Co-operators financial representative is always ready to help.
Interested in more tips and insights? Check out our Market View page for investment basics and weekly updates on market performance. You can even sign up to have this news sent directly to your inbox.
Sales charges, expenses and other fees
Fees and expenses reduce the return on your investment. For details, please refer to your Policy and Information Folder.
Current rates of return are available on our Segregated Fund Performance page. Your personal rate of return will vary, depending on the contributions and withdrawals you make over time. For details, please refer to your Policy Statement.
If you have questions about your investments, contact your Co-operators financial representative.
Aviator Portfolios® are a secure and diversified investment option
Co-operators Aviator Portfolios® – expertly designed and constructed by the highly regarded investment managers at Addenda Capital® and Franklin Templeton® – provide investors with broader diversification opportunities.
Each of the three distinct Aviator Portfolios® funds brings an opportunity to invest your hard-earned savings alongside some of Canada’s largest institutional clients, including pension funds, foundations, endowments, governments and corporations.
Aviator Portfolios® provide both regional and risk diversification, including exposure to unique asset classes, such as commercial mortgages, preferred shares and high-yield bonds, all of which behave differently than stocks.
© 2026 Co-operators Life Insurance Company.
1900 Albert St., Regina, SK S4P 4K8
Segregated funds and annuities are administered by Co-operators Life Insurance Company. Not all products are available in all provinces. This material is provided for informational purposes only. Please refer to your policy for applicable coverage details, limitations, and exclusions. The information contained in this communication was obtained from sources believed to be reliable; however, we cannot guarantee that it is accurate or complete. This communication is provided as a general source of information and should not be considered personal investment advice or solicitation to buy or sell any investment. Co-operators® is a registered trademark of The Co-operators Group Limited and is used with permission. Aviator Portfolios® is a registered trademark of The Co-operators Group Limited. Aviator Portfolios® is an investment product which may include features or options such as segregated funds, portfolios of segregated funds or guaranteed rates. Guaranteed benefits are payable on death or maturity (reduced proportionately by withdrawals from, or investment transfers out of, the segregated funds). No guarantee is provided on surrender or cancellation. Subject to any applicable death and maturity guarantee, any part of the premium or other amount that is allocated to a segregated fund is invested at the risk of the policyholder and may increase or decrease in value. Ask your advisor for details. Addenda Capital® is a registered trademark of Addenda Capital Inc. and is used with permission. Franklin, Templeton, ClearBridge and Franklin Templeton® are registered trademarks of Franklin Templeton Investments Corp. and are used with permission. ClearBridge Investments and Brandywine Global are Franklin Templeton affiliated companies.
Returns, investment segmentation and top holdings as of March 31, 2026. Rates of return for periods less than one year are simple rates of return. All others are annualized rates of return. Securities regulations do not allow us to report performance for a fund that has been available for less than one year. The returns reflect changes in unit value and assume that all income/realized net gains are retained by the segregated fund in the periods indicated and are reflected in higher unit values of the fund. The returns do not take into account sales, redemption, distribution or other optional charges or income taxes payable that would have reduced returns or performance. Past performance of any fund is not necessarily indicative of its future performance.
If you have questions or want to discuss your investments, please contact your authorized financial representative. In Quebec, a licensed insurance advisor is a Financial Security Advisor or a Representative.